Remote Photoplethysmography
Introduction
Remote photoplethysmography (rPPG) is a computer vision problem that tries to extract photoplethysmography waves from facial video. This is an interesting medical computer vision problem that we are very lucky to have our hands on. With the purpose of sharing our experiences, we write this post for anyone who feels enthusiastic about the problem to have an overview of related medical conventions, terminologies, principles, and methods. As a bonus, information on how our system is deployed is also shown here. In preparation for meaningful interpretation of our used method, we first need to introduce some basic medical concepts and terminologies.
Vital signs [1, 2, 3]
In hospitals, the measurement of vital signs is a reliable indication for doctors to know about their patients' health status.
Vital signs measure our most basic body functions. Some vital signs mostly used are:
- Pulse rate (or heart rate): is the number of heart beats per minute. Healthy adults normally have a pulse rate ranging from 60 to 100 beats per minute. The pulse rate can increase by the effect of illness, exercise, and emotions.
- Respiration rate (breathing rate): is the number of breath cycles (each cycle contains an inhale and exhale) per minute. It is usually measured when a person is at rest. You can manually check your breathing rate by counting how many times the chest rises. A healthy adult person has a normal respiration rate ranging from 12 to 16 breaths per minute.
- SpO2: is the acronym for "Saturation of peripheral oxygen". In another word, SpO2 is the ratio between oxygenated hemoglobin and deoxygenated hemoglobin. The human body needs a certain level of oxygen in the blood to efficiently operate. A low level of SpO2 means there are serious symptoms. A normal level of oxygen (SpO2) is usually 95% or higher.
- Blood pressure: is the pressure of blood against the artery walls during the heart beats (contraction and relaxation). High blood pressure leads to a higher chance of heart attack. A normal person has blood pressure less than 120/80 mmHg.
In our project, we focus on the first 3 vital signs (pulse rate, respiration rate, SpO2), which can be extracted from photoplethysmography wave.
Gold-standard machines
Traditionally, contact machines have been long-time used for vital signs measurements. They are easy to operate and give highly accurate results.
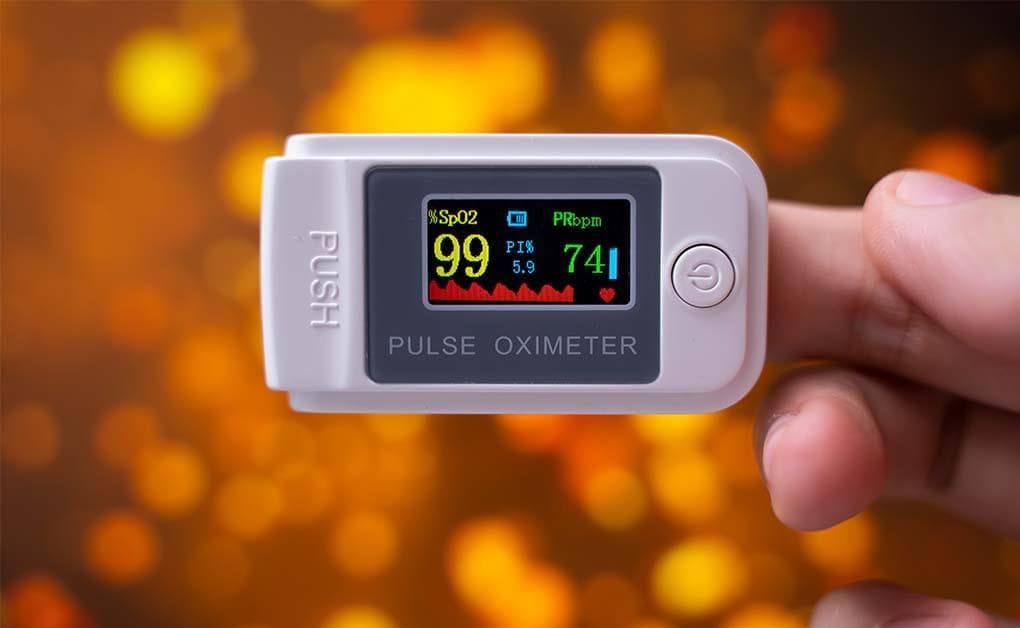
Figure 1: Pulse oximeter (image from [4]).
The operation principle of a finger pulse oximeter is essentially the same as non-contact camera-based photoplethysmography methods. That is they are based on the change of skin color. This change is not visually perceived by human eyes, but machines can read color values, which is the result of light reflectance from the skin. The details of the optical principle of photoplethysmography are explained more clearly in the following sections.
The gold-standard device is the electrocardiogram (abbreviated as ECG or EKG) machine, which is bulkier than the finger pulse oximeter and is often only seen in hospitals. The machine parts are described in the figure below.
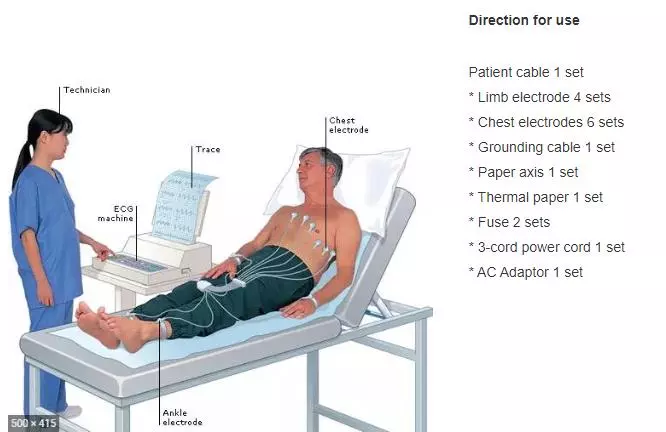
Figure 2: Electrocardiogram machine (image from [5]).
Photoplethysmography (PPG) vs Electrocardiogram (ECG) [6]
For heart rate monitoring, the most related information (wave) of PPG is the Electrocardiogram (ECG). Each wave shape is drawn in figure 3 below.
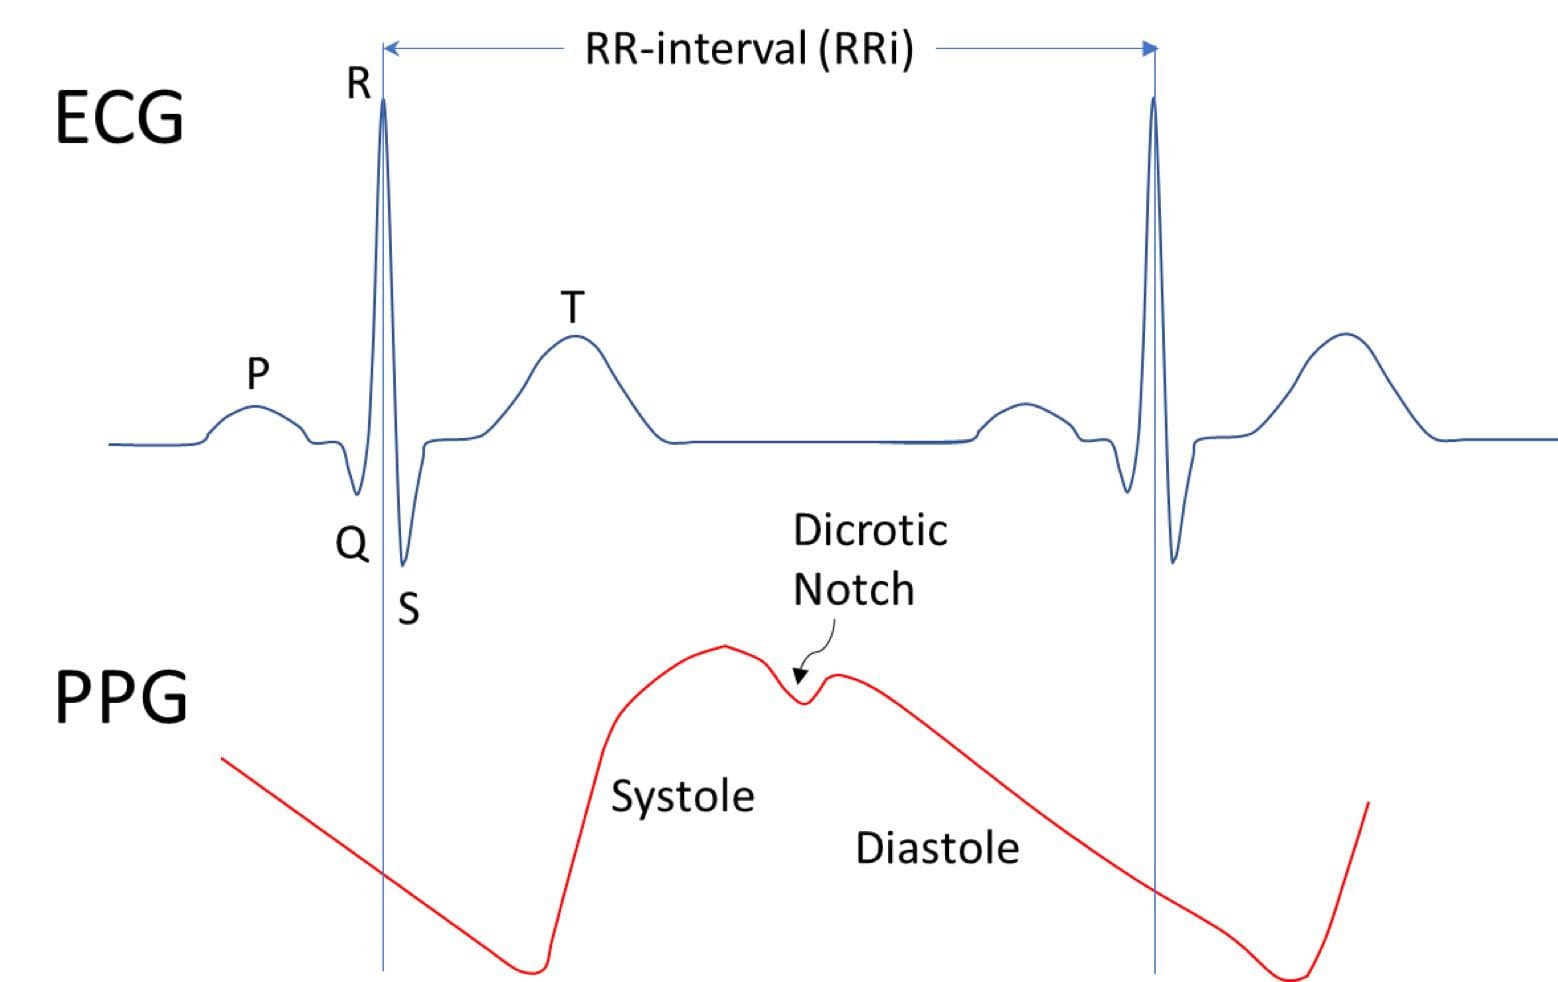
Figure 3: ECG wave vs PPG wave (image from [7]).
The discrimination between ECG and PPG will make you more clear about the properties of each type of wave. ECG machines directly use electrical signals brought out by heart activity, which is the reason why they have electrodes connected to the chest. PPG uses electrical signals derived from skin color changes (reflected light from skin), which are the results of changes in blood flow during heart activity. ECG is seen as reference information information for measuring heart rate, so its accuracy is certainly higher. In contrast, PPG sensors are more efficient in size and price, so they are more liked by families at home.
PPG wave explanation
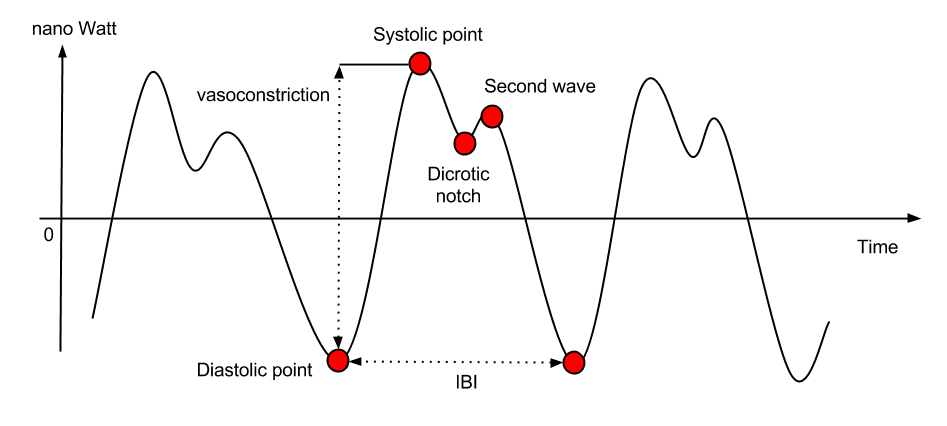
Figure 4: PPG wave (image from [10]).
Figure 4 is an example image of a PPG signal. The wave shape is likely to vary depending on the subject and environmental conditions. But in common, a PPG wave contains significant points [10]:
- Diastolic points: local minima of the PPG wave. The distance between two consecutive minima is the inter-beat interval (IBI).
- Systolic points: local maxima of the PPG wave. The distance (in nano Watt) between a Diastolic point and a Systolic point right next to it could be used to estimate the subject vasoconstriction.
- Dicrotic notch: under some circumstances (e.g. subject stays still), this point appears. It can be used to study different types of cardiac diseases.
From PPG wave, inter-beat interval (IBI) and heart rate can be calculated by algorithms.
Blood Volume Pulse (BVP) is a different name of PPG, though they share very similar measurements [8, 9]. According to [8], "BVP is the signal that results when highpass filtering the PPG signal. The choice of highpass filter is a bit arbitrary, but typically it is a value between 0.05 Hz and 0.5 Hz". According to [9], "The PPG (Photoplethysmography) data is provided by the E4 device. This is also known in the scientific literature as BVP (Blood Volume Pulse)".
Contact photoplethysmography vs Non-contact photoplethysmography
Above, we have shown some contact photoplethysmography machines (finger pulse oximeter and electrocardiogram machine). Recently, non-contact methods start to receive much attention in the research community. So, why use non-contact photoplethysmography when the contact photoplethysmography has already been at high quality?
Burned patients, neonates have sensitive skin, therefore they cannot use contact machines. Non-contact methods also help to prevent infection.
Non-contact methods receive video as input. The video can record a face, a hand, or a finger. In this post, we focus on the face video.
How can we get the heart rate from a face video? That seems unreasonable.
Now, we come to an important part - the common principle of photoplethysmography methods. There is an important thing to note: when we have a ppg wave (in programming, it is a list of values); heart rate, respiration rate, and SpO2 can be directly calculated from the wave by algorithms. Usually, this is the flow of both contact methods and non-contact methods. Thus, extracting PPG wave from video is the hardest part. Calculations after that (heart rate, respiration rate, SpO2) is usually the same for all methods, both contact photoplethysmography and non-contact photoplethysmography.
At first, you may feel it is illogical to extract heart rate from a facial video. However, when knowing the principle, you will be persuaded that it is totally possible. The blood volume change leads to the change in skin color, this means there is a correlation between blood volume change and skin color change. Therefore, it is reasonable that we can get the BVP/PPG wave from a face video. Tell about skin color change, this change is very subtle. Human eyes cannot perceive it, but computer vision can read the changes in color values. This principle of skin color changes is possible with the help of optics, which is a branch of physics that studies the properties and behavior of light.
Figure 5 below shows the mechanism of pulse oximeter. There are green light and red light. The green light is often replaced by an infrared light, which has better skin penetration. Red light and Green light illuminate the skin, then the reflected light is catched by the Light Receiver. The light is recorded as a signal wave. A signal wave is actually a list of values to show the change of skin color over time. One signal wave is of the Green Light and the other is of the Red Light. The two waves are then combined and post-processed to produce the PPG/BVP wave.
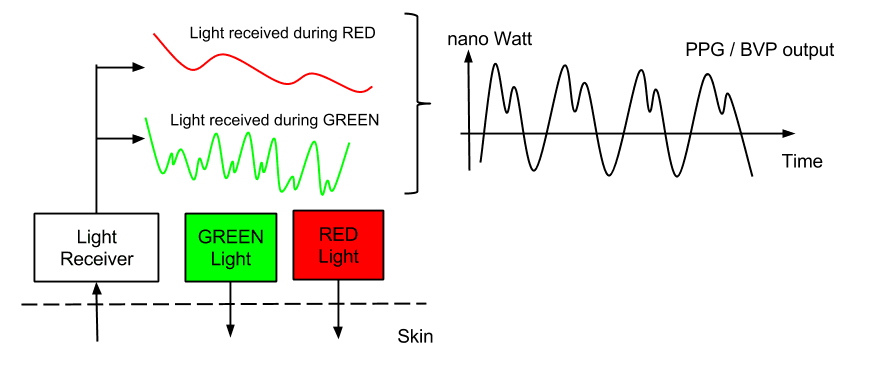
Figure 5: The mechanism of extracting PPG/BVP from skin by using reflected light (image from [9]).
The principle of camera-based photoplethysmography is the same as that of pulse oximeter. It also takes advantage of reflected light from the skin. Figure 6 below helps you to understand the similarities and differences between light-based contact and non-contact method.
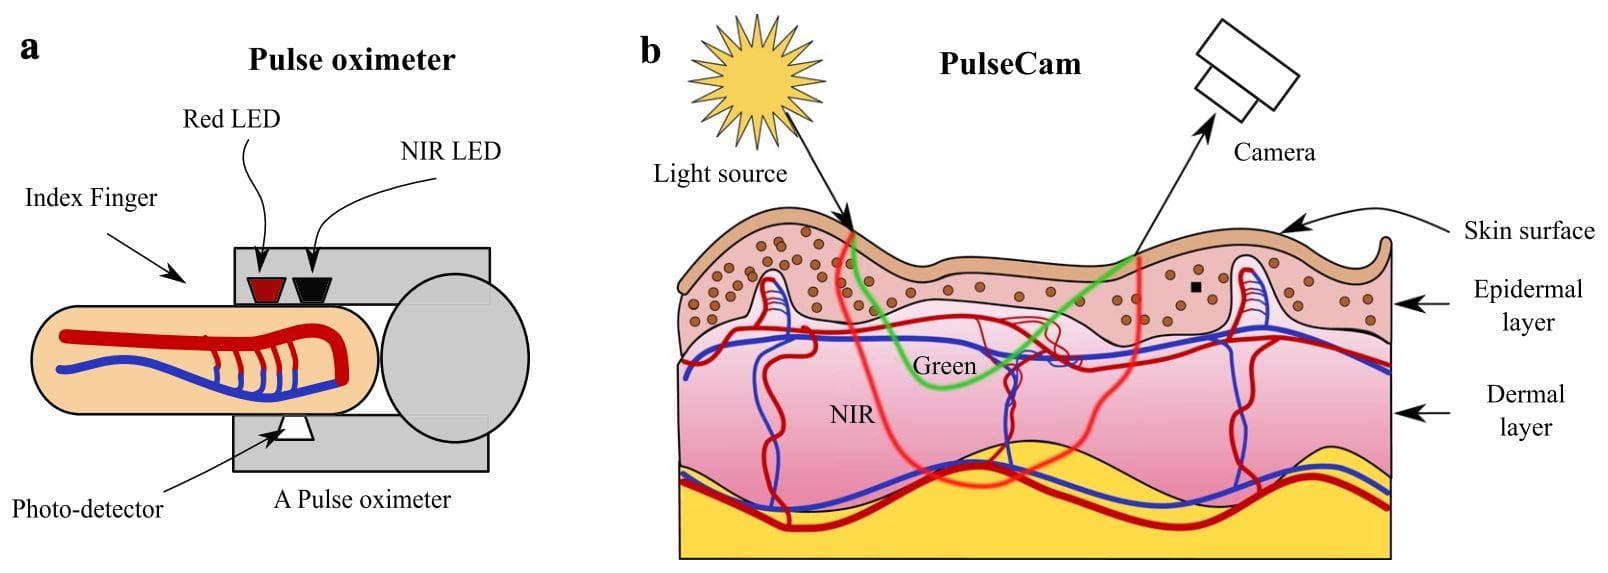
Figure 6: Differences in interaction of light between contact and non-contact method (image from [11]).
On the left is the contact method (pulse oximeter). It also has the Red Light, but the Green Light is replaced with the Near-infrared Light (NIR) because of its stronger skin penetration. And the Photo detector is to get the reflected signals and transform them into PPG wave. Heart rate (or other vital signs) can then be calculated from the PPG wave.
For the non-contact method, the idea is also the same. The small red LED and NIR LED are not needed, but ambient light (or room light) is directly used. The Photo detector is now the video camera (RGB or Infrared). You can think of it as a more general case, which is more difficult because of the noises.
Our experiences - from start to end
GOAL: We want to build a multi-threading API for measurements of vital signs (Pulse rate, Respiration rate, SpO2) using facial RGB input video.
Note that we will have 2 servers (you can also think of them as 2 APIs). One server is for uploading video files and handling the multi-threaded processes. Another server is for the Tensorflow Serving, which loads the trained model and stays there to hear requests from the first server. For each request, the second server will make prediction and send back the result to the first server.
First, we searched recent researches about Photoplethysmography using face video and found two types of methods: handcrafted methods (ICA [12], CHROM [13], POS [14], ...) and deep learning methods (SynRhythm [17], DeepPhys [16], PhysNet [15], MTTS-CAN [18]).
We choose the MTTS-CAN because it is one of the most popular and recent deep learning methods at the time this post is written. Also, it has open-source codes and a public trained model link.
Introduce and try the MTTS-CAN repo
MTTS-CAN is a two-branch network: appearance branch and motion branch. The appearance branch passes attention masks to the motion branch with the purpose of showing which image regions need focussing on (face skin regions). The learning paradigm is multi-task learning, which undertakes both tasks of predicting pulse wave and respiration wave. From pulse wave and respiration wave, we can extract heart rate and respiration respectively by Butterworth filter in the frequency domain.
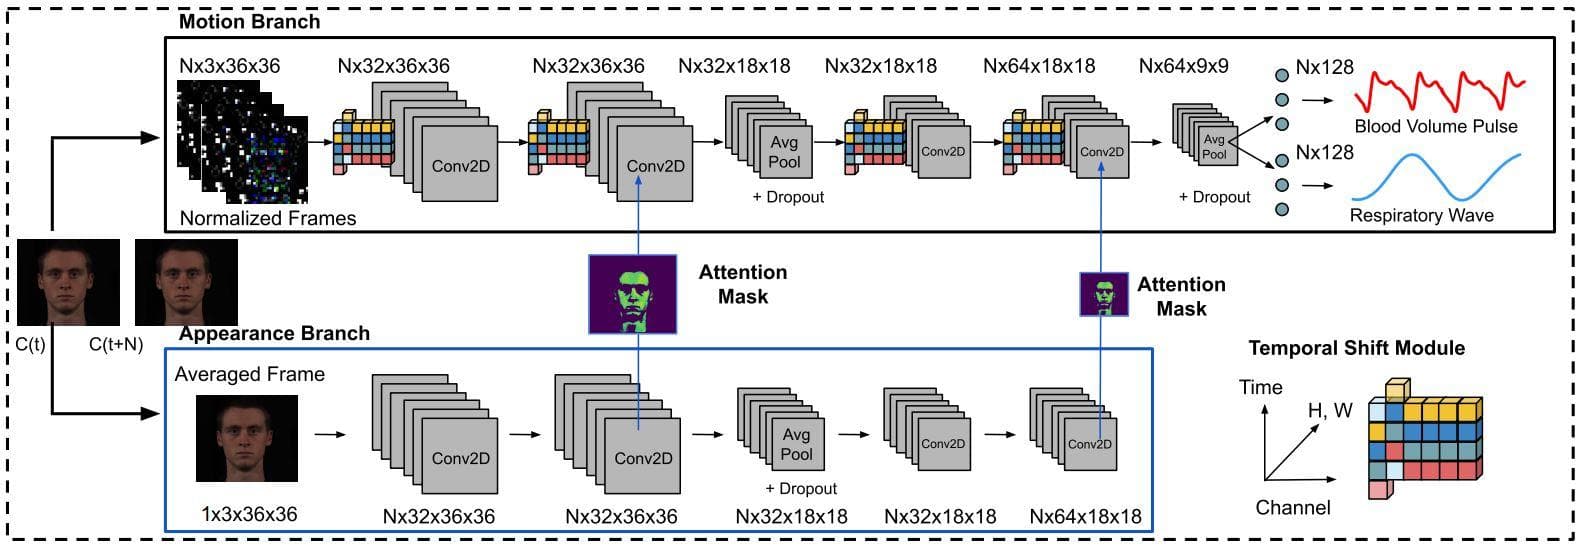
Figure 7: The network architecture of MTTS-CAN (Image from [18]).
We then recorded a face video and fed it into MTTS-CAN to see what it predicts.
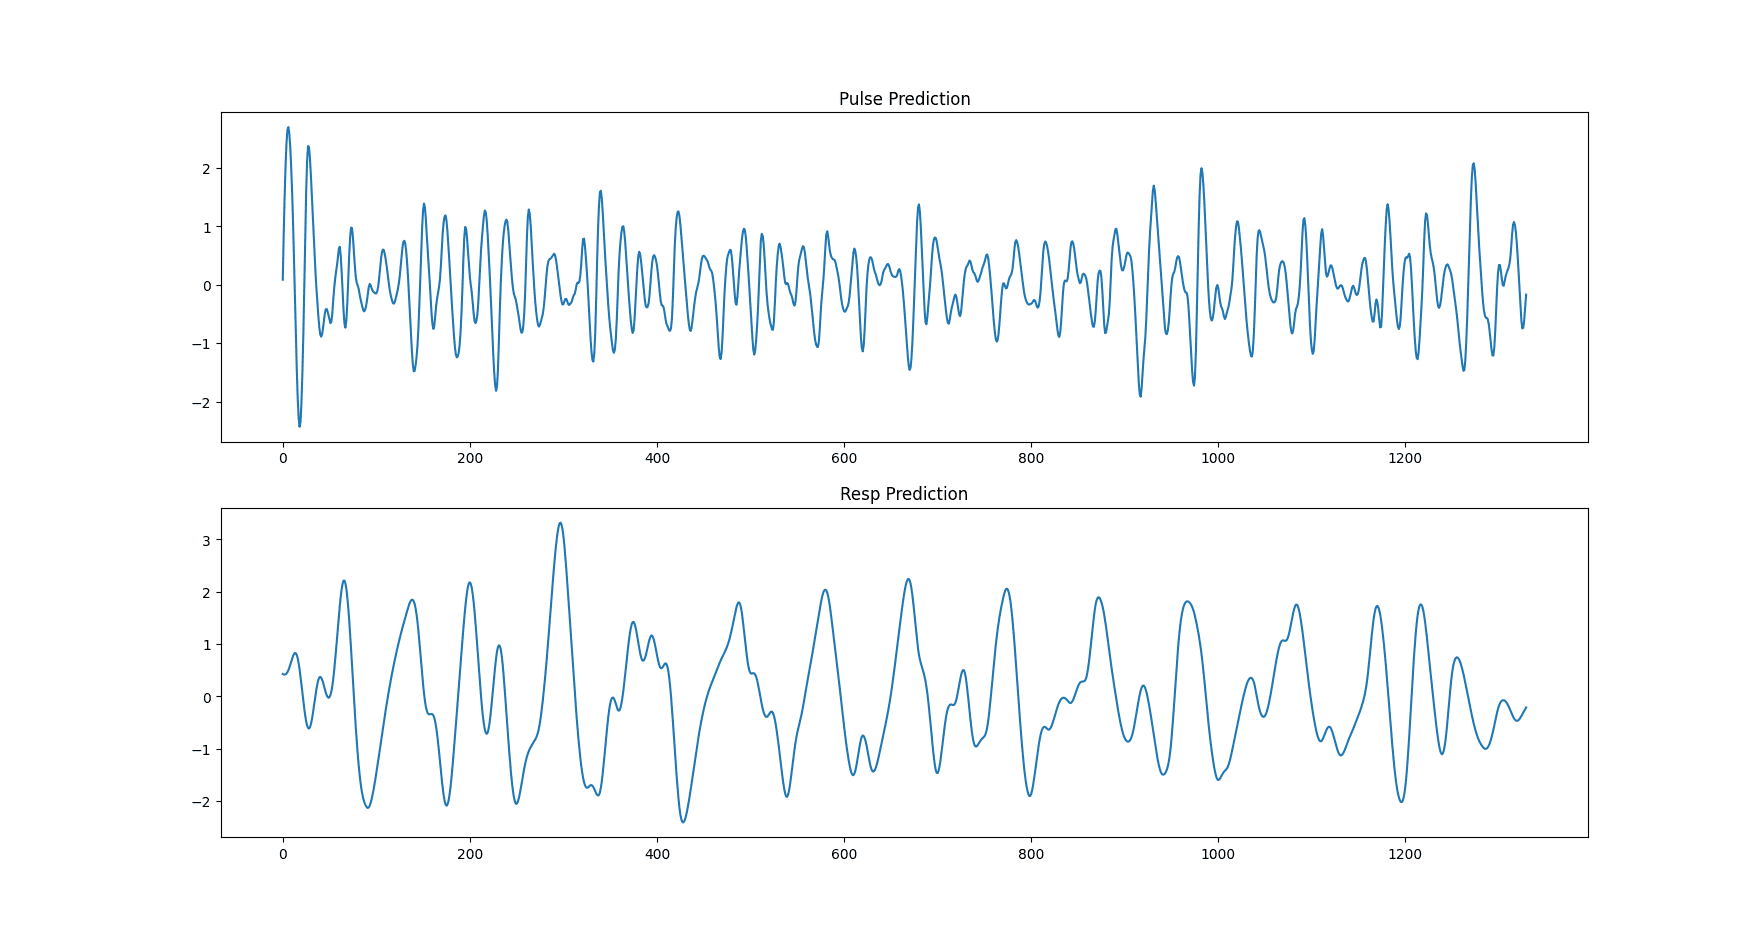
Figure 8: The predicted pulse wave and respiration wave of MTTS-CAN.
The top figure is the pulse wave and the bottom figure is the respiration rate. They are clearly different. The pulse wave has a lot more oscillations than the respiration wave. Note that the two plots are drawn by having two lists of values. The length of each list is equal to the number of frames the input video has, which means each frame has one corresponding value.
The two predicted waves above have been post-processed. 3 steps of post-processings are: detrend, Butterworth filter, scipy.signal.filtfilt. The Butterworth band-pass filter in the frequency range 0.75-2.5 Hz is applied for calculating the pulsatile heartbeat component
However, the pulse wave after the Butterworth filter contains only the AC component (pulsatile component - this will be explained more clearly in the later section). For calculating the SpO2, beside the AC component, we also need the DC component (non-pulsatile). Therefore, we also need the pulse wave that has not been processed by the Butterworth filter (has only been processed with detrend filter), so both the AC and DC components are kept for later use.
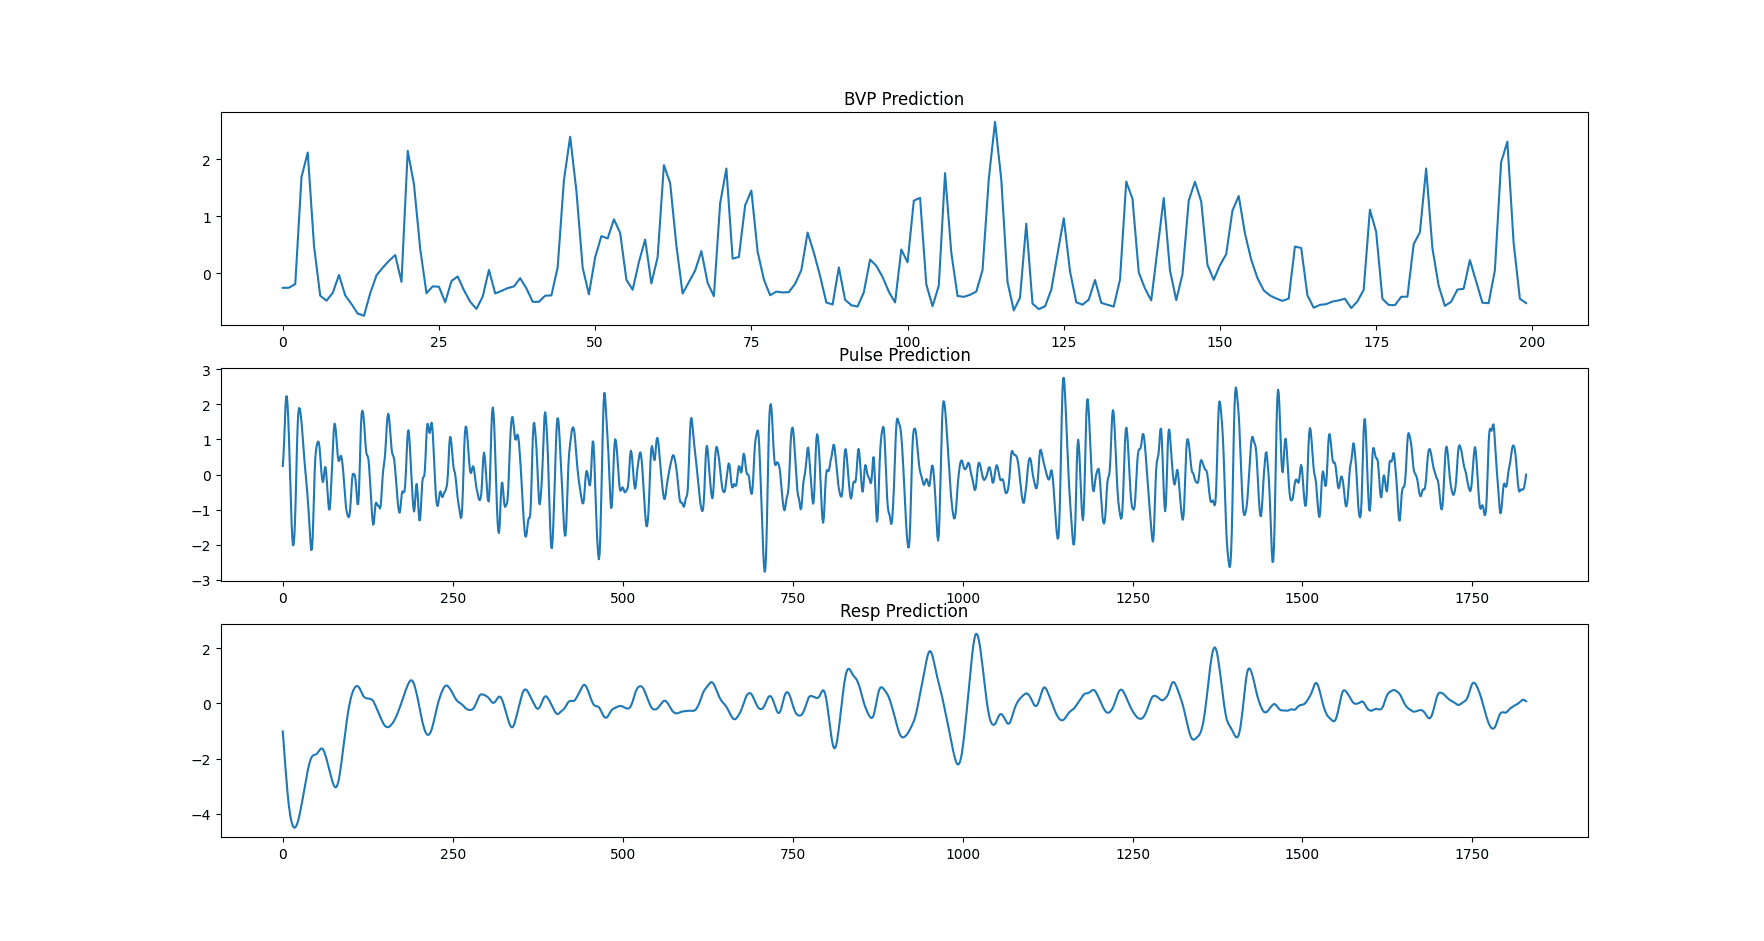
Figure 9: The predicted pulse wave without post-processing steps, the predicted pulse wave, and the respiration wave of MTTS-CAN.
The predicted heart wave of MTTS_CAN is the BVP (blood volume pulse) [18]. And according to a post link 1, BVP and PPG are 2 names but for similar measurements. Another post link 2 tells that PPG is known as BVP in the scientific literature. As a consequence, pulse wave, photoplethysmography (PPG) wave, and blood volume pulse (BVP) wave all refer to the same thing.
Deploy using Tensorflow Serving
The Tensorflow Serving is an official way to deploy Tensorflow trained model so that it can be used in production. You can make inferences in the web environment.
Another thing worth to mention is we use multi-threading. If each thread loads a trained model (.h5 file) every time, then it costs a lot of memory (RAM). We need to use Tensorflow Serving (a separate server) that loads the model only once. And for multiple predictions, we only need to send multiple requests to the Tensorflow Serving server and get the corresponding results.
First, we need to convert the .hdf5 model file provided by the MTTS-CAN author into .pb model file (to save a .pb model file directly during training, you should read more at the original page). You must have been familiar with the .hdf5 extension, which is the saved model file during training a network. The .hdf5 file is used for loading the model for continuing training or making evaluations (testings). For deployment to do inference, however, we should use .pb model file for faster inference. We first need to load the provided .hdf5 file and save the model into the .pb format:
import tensorflow as tf
import tensorflow.python.keras.backend as K

from model import TSM, Attention_mask, MTTS_CAN

img_rows = 36
img_cols = 36
frame_depth = 10
tf.keras.backend.set_learning_phase(0)  # Ignore dropout at inference
model = MTTS_CAN(frame_depth, 32, 64, (img_rows, img_cols, 3))
model.load_weights('./mtts_can.hdf5')
export_path = './inference_models/1'

tf.keras.models.save_model(
    model,
    export_path,
    overwrite=True,
    include_optimizer=True,
    save_format=None,
    signatures=None,
    options=None
)
And then, you will have a folder like this:
inference_models
└── 1
    ├── assets
    ├── saved_model.pb
    └── variables
        ├── variables.data-00000-of-00001
        └── variables.index
The folder "inference_models" stores different model versions, which are often identified by number (here is "1"). Inside the folder "1", there are several subfolders and files, but we only need to pay attention to the file "saved_model.pb".
Note: According to [19], the .pb extension and the .h5 extension (.h5 and .hdf5 are the same) have different characteristics. The .pb extension is small and efficient to parse. It is used by Tensorflow Serving to bring your trained model into production. The .h5 extension is a common file-saving format when training deep networks in Tensorflow or Keras. It cannot be used with Tensorflow Serving.
The most simple way to use Tensorflow Serving is through Docker. (A good start here). We just need a docker run to build and run a Tensorflow Serving API server. This server is to load the .pb file and serve as a prediction server. In Python, we send requests with each input in a request to the server, and the server returns a corresponding prediction result for each request.
We choose the Tensorflow Serving container that is optimized by Intel. For running the Docker container:
docker run -t --restart always -p 8501:8501 \
-v "/media/data-huy/photoplethysmography/Github/MTTS_CAN/inference_models:/models/mtts_can" \
-e MODEL_NAME=mtts_can \
-e OMP_NUM_THREADS=6 \
-e TENSORFLOW_INTER_OP_PARALLELISM=2 \
-e TENSORFLOW_INTRA_OP_PARALLELISM=6 \
intel/intel-optimized-tensorflow-serving:2.6.0-mkl
In the -v flag, the left side of the ":" is the absolute path to the folder "inference_models" and the right side is "/models/mtts_can". The environment variable "TENSORFLOW_INTER_OP_PARALLELISM" should be always set to 2. The two environment variables "OMP_NUM_THREADS" and "TENSORFLOW_INTRA_OP_PARALLELISM" should be set to the number of CPU cores your deploy machine has.
To check how many CPU physical cores, use the sequence of commands below in a terminal:
cores_per_socket=`lscpu | grep "Core(s) per socket" | cut -d':' -f2 | xargs`
num_sockets=`lscpu | grep "Socket(s)" | cut -d':' -f2 | xargs`
num_physical_cores=$((cores_per_socket * num_sockets))
echo $num_physical_cores
For sending requests in Python, we use the requests library:
import requests

data = json.dumps({"signature_name": "serving_default",
                   "inputs": {
                       'input_1': motion_dXsub,
                       'input_2': appearance_Xsub_rgb
                   }})

headers = {"content-type": "application/json"}
r = requests.post('http://localhost:8501/v1/models/mtts_can:predict', data=data, headers=headers)
We send a POST request for prediction to the url "http://localhost:8501/v1/models/mtts_can:predict", along with the data and the headers. For the headers, the "content-type" is set to "application/json". For the data, there are two keys "signature_name" and "inputs". The "signature_name" is set to "serving_default". The key "inputs" is for storing the input data which is fed to the model (through Tensorflow Serving). However, there is a small problem. Because the MTTS-CAN network receives two tensors as input, we need to find a way to integrate two inputs in the inputs key. On the internet, we found no posts telling how to feed two tensors into the Tensorflow Serving server, so we needed to experiment with a number of solutions. The one that works is to use two sub-keys ('input_1' and 'input_2'):
data = json.dumps({"signature_name": "serving_default",
                   "inputs": {
                       'input_1': motion_dXsub,
                       'input_2': appearance_Xsub_rgb
                   }})
Multi-threading
We use Celery for creating workers. For a machine that has 32 GB RAM, the number of workers should be set to 3-5. The increase in the number of workers causes an increase in the RAM used. When a video is uploaded for processing, a task is created and sent to one of the workers for processing. When a task is completed by a worker, a JSON file is returned.
Each task returns a JSON file with keys:
- 'unprocessed_bvp_ppg_wave': ppg/bvp/pulse wave without post-processing (list of values).
- 'heart_wave': ppg/bvp/pulse wave with post-processing (list of values).
- 'respiration_wave': respiration wave with post-processing (list of values).
- 'bpm1': a single value (method 1) denoting the number of beats per minute (beats per minute).
- 'mean_respiration_rate1': a single value (method 1) denoting the mean respiration rate (breaths per minute).
- 'bpm2': a single value (method 2) denoting the number of beats per minute (beats per minute).
- 'mean_respiration_rate2': a single value (method 2) denoting the mean respiration rate (breaths per minute).
- 'list_of_spo2': a spo2 value is calculated every 100 frames (list of values). If a video has 300 frames then the list has 3 values.
- 'single_spo2': the mean of SpO2 values in the list above.
Also, note that each task will cost an amount of RAM until it completes. The costed amount of RAM depends on the lasting time and the resolution of the input video. If the lasting time is long and the resolution is high, then a large proportion of the RAM is used and the speed to process that video will also be slower. Many long videos of different concurrent tasks will cost RAM quickly.
Other technical things to note about our API
- When uploading the same video file multiple times, there will be multiple tasks that process on the same video file. This problem causes errors. The best practice is to change the name of an uploaded video file so that a file name has a time pattern in it. For example, a video file should be named like this: year|month|day-hour|minute|second|microsecond. Naming like this guarantees different tasks process on different video files, even if we upload the same video file multiple times.
- The Tensorflow Serving Docker container that we use is developed by Intel, so you cannot use it on an AMD CPU. There will be a FloatDivision error when you try to use an AMD CPU.
-
There is still a step - uploading video file - that cannot go into multi-threading. So when a request is sent, the uploading step happens outside of multi-threading (normal main thread). Therefore, the uploading step of this current request has to be completed before another request is sent to the API (because all the requests dispute the same main thread). Or else the file is not fully uploaded, and the request owning this file will return failure (no JSON file).
According to some posts, there is an unofficial way to do that right on the API (our API), but:
- It is unrecommended
- It is not clean
- It saves file content to ram -> cost RAM -> there be less concurrent tasks executed than normal
-
Redis/RabitMQ, which is a message pipe for controlling sending messages to workers, is not created for sending file content. -> A good practice is to send the reference of the file (file name, file id, etc.). In our case is the file name. Upload the file on the server, and just send the name to the worker so it knows what file to work on. ...
The better way to handle is to deal with it on the backend which sends requests to our API. One solution is that you should have a queue of requests. There should be a set time interval (a delay) between two consecutive requests to guarantee a request has completed uploading its file before another request comes.
That's why we have a delay between different clickings on our demo webpage. We want to simulate the queue of requests with delay.
- The Tensorflow Serving inferences are on a CPU.
- Because the MTTS-CAN model receives a 36x36 video as input, there needs to have a resizing step on the original video. Resizing from high resolution to low resolution costs a lot of time. So, if time execution is important, you should only upload videos that are already in low resolution (lower than 1280x720 is good enough).
Heart rate, respiration calculation
We use two methods for heart rate and respiratory rate calculation.
- First method: from a branch of the MTTS-CAN repo link. The ideas of calculating heart rate and respiration rate are the same, except the frequency is chosen from 0.75 to 2.5 (HZ) for heart rate and is chosen from 0.08 to 0.5 (Hz) for respiration rate.
-
Second method:
- For heart rate, we use the code from the habom2310's repo link. The idea of the method is similar to the idea of the paper [20]. You can read the details at section IV.
- For respiration rate, we use the code from the raphaelvallat's repo link. The main idea is to calculate the number of peaks in the PPG wave (or pulse wave) which has been detrended and normalized. Because the predicted respiration wave of MTTS-CAN has been detrended and normalized, we only use a small part of the code from the IPython file:
from scipy.signal import find_peaks

window = 30 # the lasting time of an input video (in second)
sf_up = 4
# Find respiratory peaks, resp_wave is the predicted respiration wave
resp_peaks, _ = find_peaks(resp_wave, height=0, distance=sf_up)

# Convert to seconds
resp_peaks = resp_peaks
resp_peaks_diff = np.diff(resp_peaks) / sf_up
mresprate = (resp_peaks.size / window)*60 # the number of breaths per minute
All the methods are related to signal processing (frequency domain). They usually require a step of doing a band-pass filter on the raw PPG signal wave. There are a lot things to explain, so it would be best that you read the sources and figure them out.
SpO2 calculation
There is a lack of researches in SpO2 calculation when compared to heart rate calculation. This problem is mentioned in the paper [21]:
"Webcam-based IPPG techniques, with wide application prospects in health monitoring, have drawn much research attention [5–7,9]. Among these researches, HR monitoring has become increasingly mature in applications. However, there has been little progress in SpO2 extraction research [5–9]. The webcam-based SpO2 extraction research is still not mature enough for real-world application and faces many challenges."
Let's first explain what is AC and what is DC in a PPG wave (or in the reflected light). From [21], the PPG is composed of pulsatile and non-pulsatile components. Pulsatile components are considered as alternating current (AC). Non-pulsatile components are considered as direct current (DC)
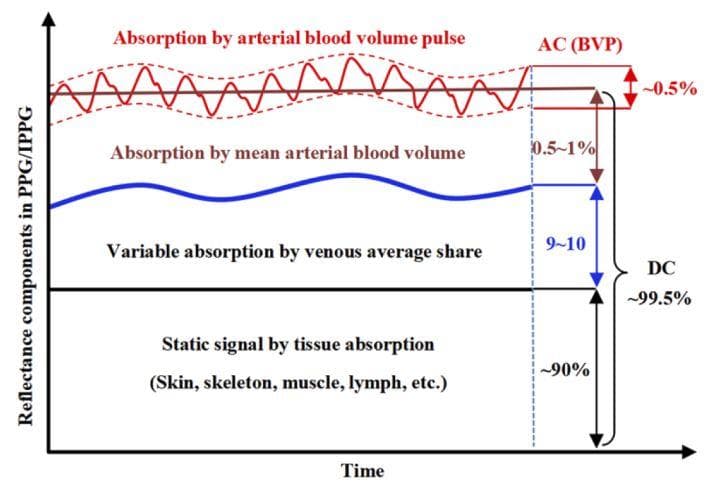
Figure 10: Reflectance components in PPG (AC and DC) (Image from [21]).
The description for Figure 10 (from [21]): "for the entire reflectance component in PPG/IPPG, the AC components represent the variable absorption caused by volume pulsation in arterial blood vessels (∼0.5%), whereas the DC components represent absorption by the mean arterial (0.5∼1%), venous average (9∼10%) blood volumes and the static signals due to tissue absorption (skin, skeleton, muscle, lymph, etc.) (∼90%)"
The principle (from [21]): "Based on the principle of SpO2 extraction, the incident light is selected to have two special wavelengths, at which the absorption by HbO2 and deoxygenated Hb in the blood are similar and different, respectively [3]. Subsequently, SpO2 parameters can be derived from the AC and DC components generated from the reflected light."
3 steps to calculate SpO2:
- calculate AC/DC from the original PPG wave.
- calculate the ratio of ratios (R): R = (ACred/DCred)/(ACinfrared/DCinfrared)
- calculate SpO2 from R by a linear function (or a quadratic function): SpO2 = A + B*R
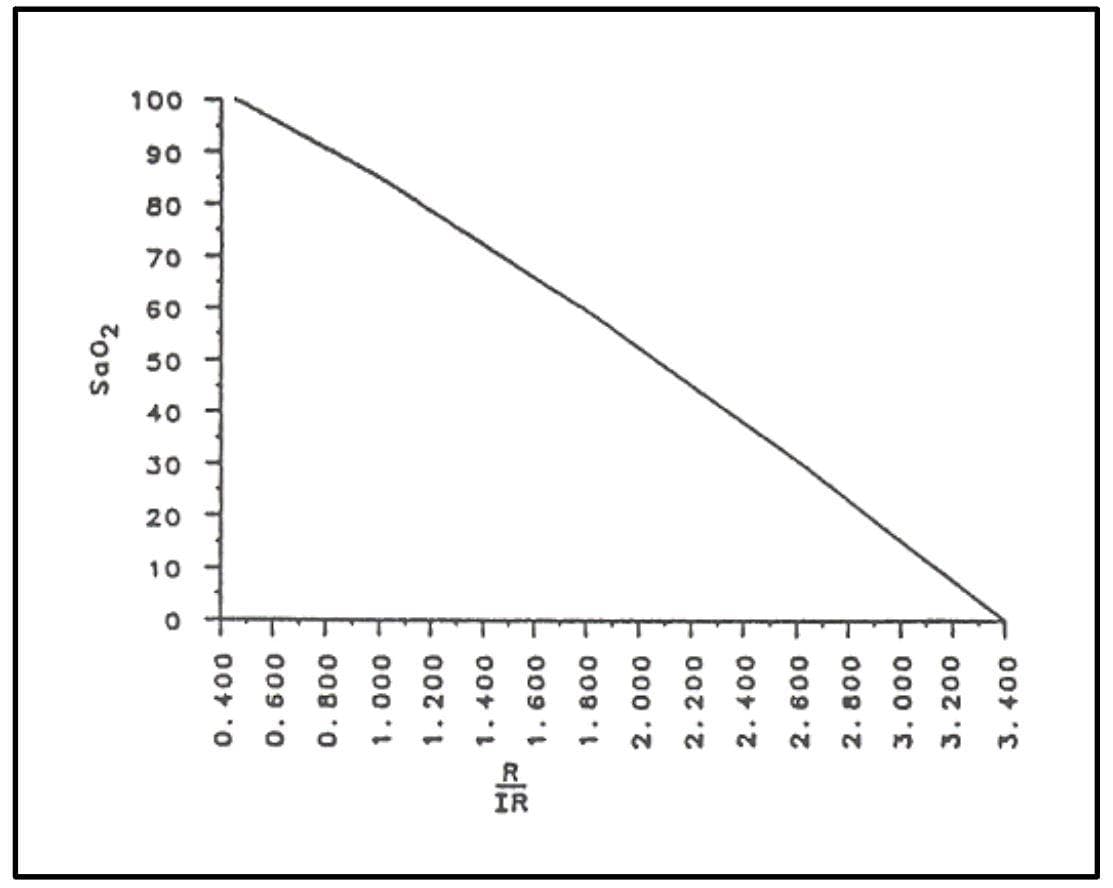
Figure 11: The relationship of SpO2 and R ratio (Image from page 16 (Figure 3.3) of [22]).
When there is no infrared wavelength, the R is calculated by the Red over Green (or Red over Blue) as an alternative to Red over Infrared.
In MTTS-CAN, the predicted pulse wave has been band-pass filtered, so it only contains AC components. We need to use the PPG wave that has not been band-pass filtered (the PPG wave that has only been detrended) to keep AC/DC in the ppg wave. When having AC and DC components, we can calculate SpO2.
Visualization
Some papers visualize to see how skin regions contribute to the construction of PPG wave. One of them is the paper [23]. The visualization method of [23] is to take advatage of the temporal change of pixel color, along with image processing techniques to produce the RPPG map. However, this method is tested in an experimental environment, which is in a very good state in which challenges have been mitigated. As a consequence, the method needs to be improved to be used in a real-world scenario.
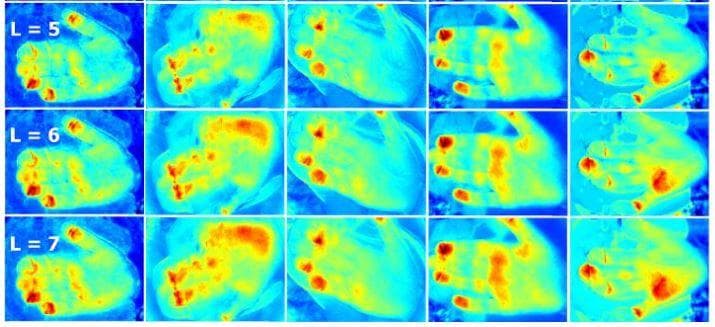
Figure 12: The RPPG image map created by the method in [23] (Image from [23]).
Conclusion - The future of non-contact photoplethysmography
Remote photoplethysmography is based on the light reflectance from the skin. Researches on remote photoplethysmography are in the first step. There are many challenges that need to be tackled so that it can be used in applications: motion, skin color variation, illumination variation, ...
References
[1][vital signs (body temperature, pulse rate, respiration rate, blood pressure)](https://www.hopkinsmedicine.org/health/conditions-and-diseases/vital-signs-body-temperature-pulse-rate-respiration-rate-blood-pressure), Health, Johns Hopkins Medicine.
[2][vital signs (body temperature, pulse rate, respiration rate, blood pressure)](https://www.urmc.rochester.edu/encyclopedia/content.aspx?ContentTypeID=85&ContentID=P00866), Health Encyclopedia, University of Rochester Medical Center.
[3] Jessica Hegg, Understanding SpO2 and Normal Oxygen Levels, HomeCare, 2016.
[4][lk89 - máy đo nồng độ oxy pulse oximeter lk89](https://thietbiyteminhhiep.com/san-pham/may-do-nong-do-oxy-pulse-oximeter-lk89/), thietbiyteminhhiep.com.
[5][accuracy ecg machine digital 3 6 channel ambulance ecg machines](https://www.alibaba.com/product-detail/Accuracy-ecg-machine-digital-3-6_1600089574904.html), Alibaba.com.
[6][ecg vs ppg for heart rate monitoring: which is best?](http://neurosky.com/2015/01/ecg-vs-ppg-for-heart-rate-monitoring-which-is-best/), NeuroSky, 2015.
[7][sensor technologies for medical-grade consumer wearables](https://www.medicaldesignandoutsourcing.com/sensor-technologies-for-medical-grade-consumer-wearables/), Medical Design & Outsourcing, 2017.
[8][blood volume](https://www.biopac.com/application/plethysmography/advanced-feature/blood-volume/), BIOPAC Systems, Inc.
[9][utilizing the ppg/bvp signal](https://support.empatica.com/hc/en-us/articles/204954639-Utilizing-the-PPG-BVP-signal), Empatica, 2021.
[10][e4 data - bvp expected signal](https://support.empatica.com/hc/en-us/articles/360029719792-E4-data-BVP-expected-signal), Empatica, 2020.
[11] Kumar, Mayank, et al. "PulseCam: a camera-based, motion-robust and highly sensitive blood perfusion imaging modality." Scientific reports 10.1 (2020): 1-17.
[12] Poh, Ming-Zher, Daniel J. McDuff, and Rosalind W. Picard. "Non-contact, automated cardiac pulse measurements using video imaging and blind source separation." Optics express 18.10 (2010): 10762-10774.
[13] De Haan, Gerard, and Vincent Jeanne. "Robust pulse rate from chrominance-based rPPG." IEEE Transactions on Biomedical Engineering 60.10 (2013): 2878-2886.
[14] Wang, Wenjin, et al. "Algorithmic principles of remote PPG." IEEE Transactions on Biomedical Engineering 64.7 (2016): 1479-1491.
[15] Yu, Zitong, Xiaobai Li, and Guoying Zhao. "Remote photoplethysmograph signal measurement from facial videos using spatio-temporal networks." arXiv preprint arXiv:1905.02419 (2019).
[16] Chen, Weixuan, and Daniel McDuff. "Deepphys: Video-based physiological measurement using convolutional attention networks." Proceedings of the European Conference on Computer Vision (ECCV). 2018.
[17] Niu, Xuesong, et al. "Synrhythm: Learning a deep heart rate estimator from general to specific." 2018 24th International Conference on Pattern Recognition (ICPR). IEEE, 2018.
[18] Liu, Xin, et al. "Multi-task temporal shift attention networks for on-device contactless vitals measurement." Advances in Neural Information Processing Systems 33 (2020): 19400-19411.
[19] Szymon Maszke, Difference between .pb and .h5, Stack Overflow, 2020.
[20] Rahman, Hamidur, et al. "Real time heart rate monitoring from facial RGB color video using webcam." The 29th Annual Workshop of the Swedish Artificial Intelligence Society (SAIS), 2–3 June 2016, Malmö, Sweden. No. 129. Linköping University Electronic Press, 2016.
[21] Wei, Bing, et al. "Analysis and improvement of non-contact SpO2 extraction using an RGB webcam." Biomedical Optics Express 12.8 (2021): 5227-5245.
[22] Johnston, William S. Development of a signal processing library for extraction of SpO2, HR, HRV, and RR from photoplethysmographic waveforms. Diss. Worcester Polytechnic Institute., 2006.
[23] Rubīns, Uldis, Jānis Spīgulis, and Aleksejs Miščuks. "Photoplethysmography imaging algorithm for continuous monitoring of regional anesthesia." Proceedings of the 14th ACM/IEEE symposium on embedded systems for real-time multimedia. 2016.